Shruti Bhat PhD, MBA, Lean Six Sigma Black Belt
  • Home
  • Consulting
  • Workshops
  • Articles
  • Patents
  • Publications
  • Books
  • Videos
  • Blog
  • Contact

Popular Workshops & Webinars on 'Continuous Improvement' for Research and Product Development

2/9/2019

0 Comments


Shorten Product Development Times, Error-Proof Products & Services, Build Quality-by-Design and Increase R&D Productivity with Lean, Kaizen, Six Sigma and Other Continuous Improvement Methodologies

Some of the Popular Continuous Improvement Workshops & Webinars Conducted by Dr. Shruti Bhat to Increase R&D Efficiency -

Lean Innovation workshop by Dr Shruti Bhat
Mistake-proofing with FMEA and Poka Yoke, workshop by Dr Shruti Bhat
building capability and culture for innovation in your organization workshop by dr shruti bhat
design thinking masterclass by Dr Shruti Bhat
product development via quality by design workshop by Dr Shruti Bhat,
DFSS and Hoshin Kanrii for innovation and product development workshop by Dr Shruti Bhat
kaizen masterclass for manufacturing and service industries by shruti bhat
Continuous improvement tools for manufacturing and service industries workshop by Dr Shruti Bhat

    For brochures and other details Contact Us

SEND
About Shruti Bhat PhD, MBA, Certified Lean Six Sigma Black Belt
 
Dr. Shruti Bhat is an award-winning Business Excellence Leader, Global Continuous Improvement Mastermind, Best-selling Author and Speaker. She is Continuous Improvement Advisor to several start-ups, mid-size and growing firms in Canada, USA, India, Africa and Emerging markets. She has authored eight business books and is an invited speaker at several national and international conferences, symposia and workshops.


​Follow Shruti on Twitter, Facebook, YouTube, LinkedIn
#ContinuousImprovement #QualityImprovement  #Innoworks  #Innovation   #eLearning  #LeanInnovation    #LeanManagement  #KaizenLeaderMasterclass ​
0 Comments

Microbial contamination in lake and dye colors- Part 3 of 3

11/1/2013

0 Comments

 
Continued from Part 2 ...
​

Isolation and identification of bacteria-


The isolation was done by transferring the colonies from nutrient agar plated to sterile enrichment broth media. These included MacConkeys broth (for detection of Staph.aureus) and Cetrimide broth (detection of P.aeruoginosa). The specimen tubes were incubated for 48 hours at 37 + 1 oC in inverted position for
24 hours and 507 days.

Allocation of mannitol salt agar B30-

The colonies grown on Vogel –Johnson’s medium was streak plated on sterile mannitol –salt agar medium for confirmation regarding presence/ absence of Staph. aureus . Pure staphylococcus culture ATCC 12600 was simultaneously streaked on separate plates to serve as positive control.

Further study of culture on selective media-

The colonies grown on Vogel- Johnson’s medium and MacConkeys medium were tested for Gram reactions and motility characteristics.

Biochemical tests-

In order to further ensure that the organisms cultured on Vogel- Johnson’s and Mac Conkeys agar were probably E.coli, Staph. aureus or Salmonella species, the inoculums of the colonies from respective agar medium were employed in biochemical tests comprising of hydrolysis of starch, nitrate reduction, oxidase and catalase activity, liquefaction of gelatin, IMVic, Oxferm reaction etc. 
 
The contents of this article belong to extensive laboratory work done by me to assess microbial contamination on few brands of dye and lake colors available in the market.
​Follow Shruti on Twitter, Facebook, YouTube, LinkedIn
#MicrobialContamination #DyeColors  #LakeColors
0 Comments

Microbial contamination in dye and lake colors- Part 2 of 2

9/1/2013

0 Comments

 
Continued from Part 1 ...
​
EXPERIMENTAL-

Materials-

Marketed samples of Indigo carmine, Sunset yellow, Erythrosine and Ponceau 4R dye and their aluminum lakes. Materials used in the preparation of the lakes including aluminum hydroxide powder (batch nos. 103,374,AD3 and paste P61).  Nutrient agar, Vogel-Johnson’s medium, Mac Conkeys medium, Cetrimide medium and agar media of these and mannitol salt agar were from M/s Hi media, India. Other stains and chemicals employed were of highest purity.

Methods-

Sampling, sample handling and sample condition-

 
All the samples obtained were powders, excepting aluminum hydroxide, which was supplied also as a paste. The samples were received in tightly closed glass bottles.

Sample treatment-

The surface of the sample container was disinfected with an aqueous mixture of 80 % alcohol v/v and 1 % v/v. The surface was dried with sterile gauze before opening and removing the contents in laminar air flow cabinet.

Microbial evaluation-

(I) Preparation of stock inoculums -


One-gram test sample was aseptically inoculated in 25 ml of sterile nutrient broth. The inoculated medium was kept undisturbed for about 15 minutes, to ensure complete transfer of microbes from sample to the medium. The clear supernatant liquid was then used a sample for performing the tests.

(ii) Determination of MPN by serial dilution method-

One ml of stock inoculums prepared as mentioned under (i) was diluted with 9.0 ml nutrient broth to give a dilution of 1:10. this was further serially diluted with sterile nutrient broth to give 1:100, 1:1000 and 1: 10000
dilutions.

The labeled tubes were inoculated at 37 + 1 deg.C for 24- 48 hours and 5-7 days after which they were observed for the presence or absence of growth. The tube in which the growth was not clear from appearance was sub-cultured into fresh sterile nutrient broth tubes (0.1 ml was inoculated into 10 ml sterile nutrient broth). Negative and positive (E.coli ATCC 11775) control was maintained to test the effectiveness of sterilization procedures and growth promoting property of the nutrient media respectively.

(iii) Determination of bacterial count by plate count technique-

The stock inoculums prepared under (i) was serially diluted with sterile physiological saline to give 1:10,1:100,1:1000,1:10000 ,1:1,00,000 ,1: 10,00,000 dilutions. Depending on the MPN count values determined above in (1) 1.0 ml of the last two dilutions of the sample showing growth were pour plated using 15.0 ml of sterile nutrient agar. The plates were then incubated at 37 + 1 deg.C for 24 hours and 5-7 days and the MPN values were determined.

(iv) Detection of fungi-

One ml of the stock inoculums mentioned under (i) was added to 90 ml of Saborauds broth. Positive control (Candida albicans ATCC) and negative controls were maintained side by side. The tubes were incubated at room temperature (RT) for a period of 7-15 days. 
 
In the next post, we shall discuss further on the experimental and isolation procedures of the microbes. To be continued in Part 3
​Follow Shruti on Twitter, Facebook, YouTube, LinkedIn
#MicrobialContamination  #DyeColors  #LakeColors
0 Comments

Microbial contamination in dye and lake colors - Part 1 of 2

2/1/2013

0 Comments

 
​With the advent of out-sourcing of pharmaceutical products especially by Americas and the western world, pharma products have to meet international standards. This is not possible if quality is built into the product all the way through its trajectory from birth i.e. production development till marketing and administration to patients.

Therefore, all materials that get into a pharmaceutical product need to be closely scrutinized for its quality aspects. A commonly used excipients in formulation is color. Although, the percentages of color used in pharma products is quite low, the effect of color on formulation stability or ability of coloring ingredient for destabilizing products is well known. 

Presence of microorganisms in large numbers in drugs and cosmetics preparations is undesirable since it may lead to spoilage of products. The product can change in color, consistency or manifest visible growth. Furthermore, presence of microbial contaminants would constitute a potential hazard to public health although reports on contaminated cosmetics are rare.

A critical component involved in color stability is the microbial load. Some preliminary work on microbial contamination in cosmetics has been reported absent twelve years back from this laboratory. The earlier work in this field has been reported by Doren , Woodward , Riger , Wederburn, Kalings and Bruck . 

Various sources of contamination by microorganisms have been enumerated . Raw materials are likely sources of microbial contamination and should be examined microbiologically on a routine basis. Even IP, BP and USP have recognized this fact and have set standards for total number of aerobic bacteria in a variety of products for e.g. gelatin, aluminum hydroxide gel etc. A published report by FIP working party indicated presence of high levels of microorganism not only in substances of animal and vegetable origin but also of synthetic or purified
substances including talc, kaolin, vitamins, lactose etc.

Dye colors and their lakes used for improving the elegance of the medicines and cosmetic products could become a potential source of microbial contamination in these formulations. Although the colorants are evaluated for their toxicity, their safety as regards the microbial contamination has attracted very little attention of the regulatory authorities. The methods for evaluation of medicinal preparations are given in official compendia while those for cosmetic preparations have been adequately described by Lucas (Ref 9-12).

With this background and the fact that, the regulatory authorities might include the limits of microbes in colorants work on lakes manufactured by one company has been undertaken. The contents of the case study disclosed here is authentic. This article is published here in to give an update of our research findings to the scientific community at large with out compromising in any way the confidentiality of the matter with all associated with this work.

​To be continued in part 2 ...
​Follow Shruti on Twitter, Facebook, YouTube, LinkedIn
#MicrobialContamination  #DyeColors  #LakeColors
0 Comments

Quantitative Estimation : HPTLC Vs HPLC pros and cons - Part 4 of 4

12/13/2012

0 Comments

 
Continued from Part 3 ...

Results and Discussion:

Identification test-


Mass, IR spectral data and DSC thermo gram indicated that the pseudoephedrine test sample had high purity and compared well with the reference standard.

Method validation-

Under the chromatographic conditions described, the migration distance obtained in the case of both the reference as well as the test samples of pseudoephedrine hydrochloride was 34.0 mm (Rt – 0.41). the reference standard sample showed a single band. The test for selectivity employing mixture of pseudoephedrine HCl and phenylephrine showed sharp separation of HPTLC plate in the solvent system containing formic acid as mentioned earlier and compared well with the respective reference standard. The migration distance of pseudoephedrine HCl and phenylephrine were 34.0 mm (Rt – 0.41). and 51.0 mm (Rt – 0.62). respectively.

Observation on the limits of detection and quantification, selectivity, linear range and ruggedness of the proposed method were as follows-

Limit of detection (μg) 5
Limit of quantification (μg) 10
Linear range (μg), regression coefficient, r= 0.999 35-140
Sensitivity (units) 11.2
Ruggedness (%CV) between analysts 1.224
Ruggedness (%CV) between laboratories 2.32

Comparing the accuracies (%CV calculated over the linear range) of the HPLC and HPTLC method, It was found that the accuracy of the former was 1.362 units, while that of the latter was 3.002 units.

Application to stability studies-

The results of the stability studies indicated that there was probably no interference of degradation products during the assay. The degradation products however, were not identified since the reference standards for the same were not available.

CONCLUSION-

A simple, selective and rugged HPTLC method has been developed and validated for determining pseudoephedrine HCl powder. The proposed method is comparable to the HPLC method (reported earlier in the literature). The HPTLC method can be applied for studying the stability of the pseudoephedrine HCl and sulphate samples stored under stress conditions of temperature and humidity. The method further needs to be tried for the analysis of pseudoephedrine in solid and liquid dosage forms.
​Follow Shruti on Twitter, Facebook, YouTube, LinkedIn
#Pseudoephedrinehydrochloride  #HPTLC  
0 Comments

Quantitative Estimation: HPTLC Vs HPLC pros and cons- Part 3 of 4

12/12/2012

0 Comments

 
Continued from Part 2 ...


Method validation: selectivity, limit of detection, limit of quantification, linearity range and sensitivity-

The selectivity of the method was checked by spotting 50μg x μl –1 of pseudoephedine HCl (a structurally related drug) individually and as a mixture (in 1:1 proportion) on a plate. Rest of the procedure followed was a described above under, “preparation of calibration curve”. The limit of detection, limit of quantification, linearity range of the calibration curve and sensitivity (which is the slope of the calibration curve) were also determined.

Accuracy-

Accuracy of the assay was determined following standard procedure; the results obtained by spotting known amount of drug applied on the plate were compared with the experimental values. The accuracy was expressed in terms of % basis using the following equation-

% Bias = Observed value – Original concentration
-------------------------------------------------------------------------- x 100
 Original concentration

 
Precision-

The inter- day assay variability was calculated for all concentrations in the linearity range (35,70,105 and 140 μg). The intra- day variation was determined on six replicate samples of a low (35 μg) and a high (140 μg) of the concentration curve.

Ruggedness-

Ruggedness of the analytical method was determined by the analysis of the same sample of pseudoephedrine HCl in two separate laboratories having similar equipments by three different analysts on consecutive days for a week. The coefficient of variation (%CV) amongst the results obtained was calculated.

Comparison of HPTLC with HPLC-

The accuracy of the proposed HPTLC method was compared with a reported HPLC method of estimation of pseudoephedrine HCl (detected at 210 nm) using Partisil SCX (10μm) HPLC column (25cm x 4.6 mm). The mobile phase comprised of 24 mM phosphate buffer (pH=2.3) in 50 % aqueous acetonitrile solution (1.5 ml per min.).

Applicability to stability studies-

The proposed HPTLC technique was applied in evaluating the stability of pseudoephedrine HCl samples stored under exaggerated conditions of temperature (40,50 and 60 + 1 deg.C) with relative humidity of 58,75 and 90 %. The standard samples (70 μg /ul) during the analysis were spotted after every 10 tests samples during the analysis. The method was also applied in the analysis of aged pseudoephedrine sulphate samples stored under similar conditions; the details of the stability studies are being published elsewhere.

In the next post, we shall take up discussion on results and discussion of these experiments. 
To be continued in Part 4 ...
​Follow Shruti on Twitter, Facebook, YouTube, LinkedIn
#PseudoephedrineHydrochloride  #HPTLC
0 Comments

Quantitative Estimation : HPLTC Vs HPLC pros and cons - Part 2 of 4

12/6/2012

0 Comments

 
Continued from Part 1 ...

Instruments-


Camag HPTLC system comprising of Camag IV sample applicator Linomat, Hamilton syringe 100 micro liter, Camag twin trough chamber (20x10 cm2), Camag scanner Ii V3.14 with ACTS software version 3.12, HPLC unit (Jasco PV 980) equipped with intelligent sampler (Jasco 851), Intelligent UV-Vis detector (Jasco model 875) and integrator (Jasco model 870 IT), Mass spectrometer (Schimadzu QP 1000) equipped with EI mode, FTIR spectrophotometer (Jasco model FT/IR- 45300), Differential scanning calorimeter (Schimadzu model DT040 thermal analyzer equipped with chromatopac CR 6A integrator).

Drugs, chemicals and other materials-

Silica gel 60 F 254 HPTLC plates (20x 10 cm, Merck), pseudoephedrine hydrochloride USP, pseudoephedrine sulphate USP, (from a reputed Indian company), pseudoephedrine hydrochloride reference standard (B.Knoll, Germany), phenyl ephedrine reference standard (B.Knoll, Germany), ethylene dichloride and benzene (HPLC grade, Spectra Chem., India), toluene, ethyl acetate, cyclohexane, acetone, methanol and chloroform (HPLC, E.Merck India grade), potassium hydroxide GR and ammonia (Qualigens, India) and formic acid 98/100 % (BDH grade, India ). All the chemicals were used without further treatment. All volumetric glassware used for the study was calibrated.

Stock solution of pseudoephedrine hydrochloride (reference standard) 7 μg x ul –1 (A) was prepared by dissolving 70 mg of the material in degasses distilled water in a 10 ml volumetric flask.

Identification and purity of pseudoephedrine hydrochloride test sample-

Mass spectrum, IR spectrum and DSC thermo gram of pseudoephedine (test sample) were recorded using the instruments mentioned earlier and the data obtained were compared with those of the reference sample. Due to some difficulties, the impurity profile of the pseudoephedrine HCl could not be determined.

HPTLC of pseudoephedrine hydrochloride- Preliminary experiments-

Pseudoephedine HCl was spotted on HPTLC plate using Linomat IV. The plate was developed in a twin trough chamber. A single band was obtained indicating high purity of the test sample. However, the bands either failed to migrate from the base line or they almost migrated to the solvent front. Among all the reported systems employed including ethylene chloride – methanol- benzene (70:25:5 v/v/v) showed good movement of the band except that it showed tailing. Further studied on this has been presented here.

Preparation of calibration curve, sample application, plate development and densitometric evaluation-

Stock solution A was prepared as mentioned above 1,2,5,10,15 and 20 μl of this solution corresponding to 7,14,35,70,105 and 140 μg respectively of pseudoephedrine HCl were spotted as individual bands using Camag Linomt IV sample applicator equipped with a 100 μl Hamilton syringe. The plate was developed to a distance of 80-85 mm (35-40 min) in a solvent system consisting of ethylene dichloride- methanol-benzene- formic acid (14 :4:2:1 v/v/v/v) in a Camag twin trough chamber pres-saturated with the solvent system for a period of not less than 45 minutes.

The developed plates were scanned densitometrically observing the following conditions: [I] lamp deuterium. [ii] Scanning speed 4.0 mm/s, [iii] slit dimensions 4x3 mm2, [iv] detection wave length 254 nm, [v] sensitivity 230 units and [vi] span 40 units.

The migration distance (MD) of the band was taken as the response standard during the scanning and integration of the developed bands. Peak area (AUC) was then plotted against the concentration values to obtain a calibration curve.

In the next post, I shall take up discussion on method validation and its results. To be continued in Part 3 ...
​Follow Shruti on Twitter, Facebook, YouTube, LinkedIn
#PseudoephedrineHydrochloride  #HPTLC  #Densitometry
0 Comments
<<Previous

    New Book Released!

    kaizen for pharmaceutcials, medical devices and biotech industry book by Dr Shruti Bhat
    Picture

    Shruti Bhat
    PhD, MBA
    Certified Lean Six Sigma Black Belt

    ​Shruti is a ​Global Leader in Lean Innovation, Lean Manufacturing, Business Transformation and Continuous Improvement; Best-Selling Author and Speaker.

    Shruti is a Go-To Scientific Expert and Management Leader within Pharmaceutical, Health Care, Device Technology, Bio- Technology, Life Sciences, Retail industry  and affiliated verticals.

    Shruti is a true 
    Thought Leader, who has ​accomplishments, awards, books, patents and several publications in peer reviewed journals. ​
    Read more

    Shruti's books...

    Picture
    shruti bhat, business process management, continuous improvement
    Picture
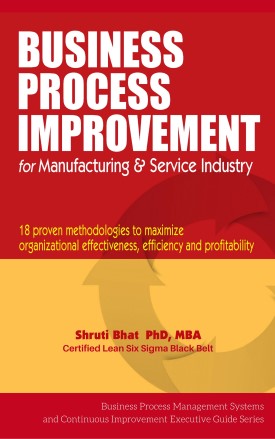
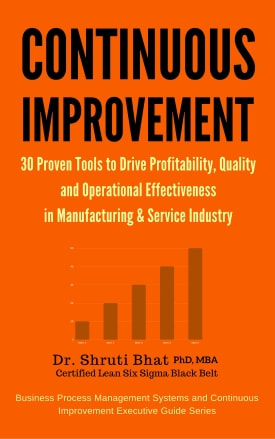
    Book on Continuous improvement tools by Dr Shruti Bhat
    kaizen for leaders, continuous process improvement tool to increase profit and organizational excellence by shruti bhat
    kaizen, shruti bhat, continuous improvement, quality, operations management

    Blog Categories

    All
    3D Printing
    5S
    Agile
    Automation
    Balanced Score Card
    Biotechnology
    Books
    Business Turnaround
    Case Studies
    Change Management
    Chemical Industry
    CMMI
    Continuous Improvement
    Design Thinking
    Digitalization
    Drug Delivery
    External News Links
    Food Industry
    Hall Of Fame
    Health Care
    HR Development
    Innovation
    ISO
    Just In Time
    Kaizen
    Leadership
    LEAN
    Lean Six Sigma
    Life Sciences
    Manufacturing
    Medical Devices
    Mistake Proofing
    Motivational Cards
    Nanotechnology
    Operations
    Packaging
    Patents
    Personal Products
    Process Improvement
    Product Development
    Productivity Increase
    QbD
    Quality Management
    Robotics
    Service Industry
    Six Sigma
    Strategy
    Supply Chain Logistics
    Telecom Industry
    TQM
    Videos
    Voice Of Customer
    Workshops

    Micro-Learning
    ​Partner

    Picture

    Publishing Partner

    fast read books, business management books, health and wellness books, spiritual guidance books, best online book store

    Wellness
    ​Partner

    Picture
© Copyright 1992- 2021 Dr. Shruti Bhat ALL RIGHTS RESERVED.
See Terms and Conditions on this site usage.
SHRUTI BHAT, CONTACT
Click to connect.
Created by Macro2Micro Media